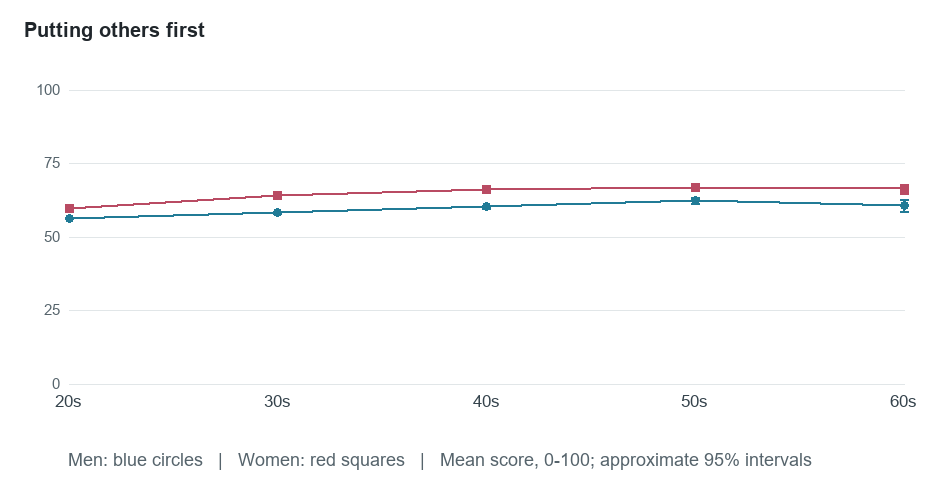
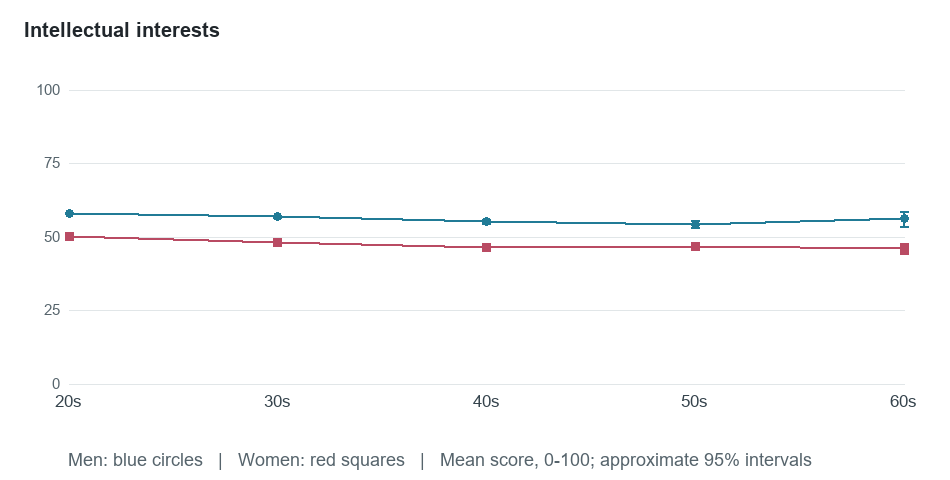
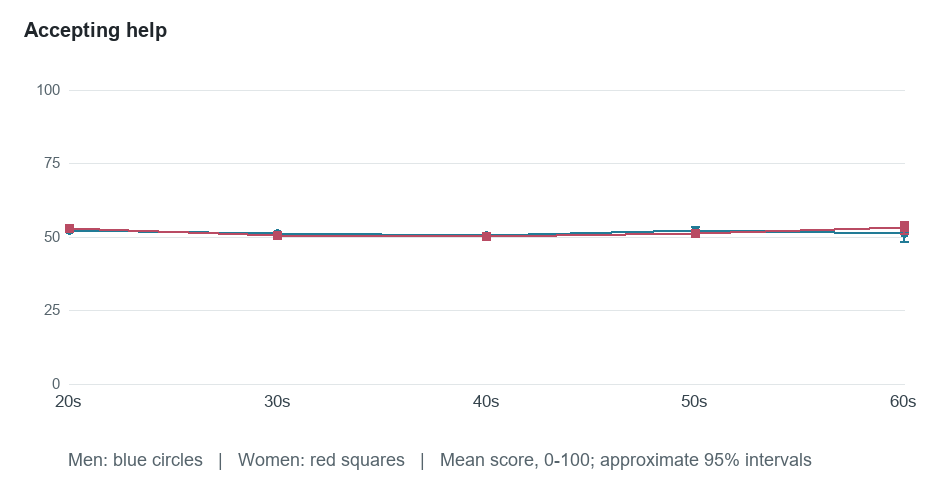
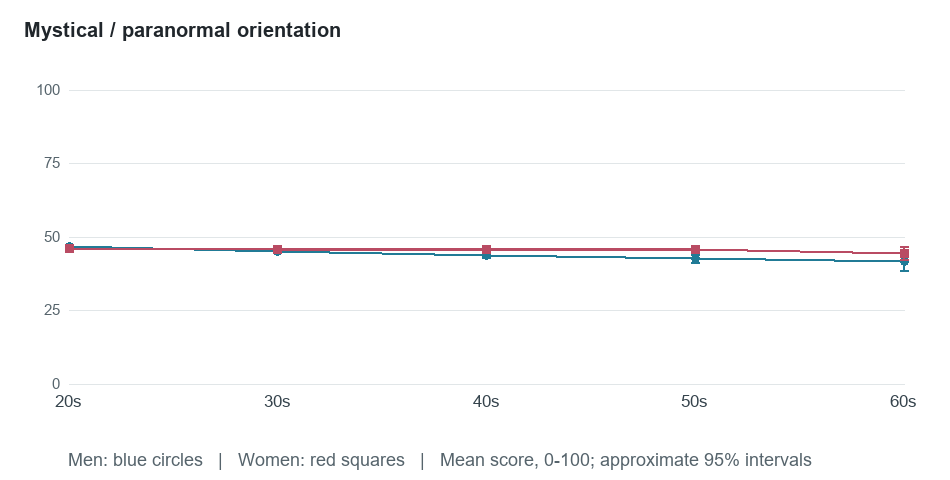
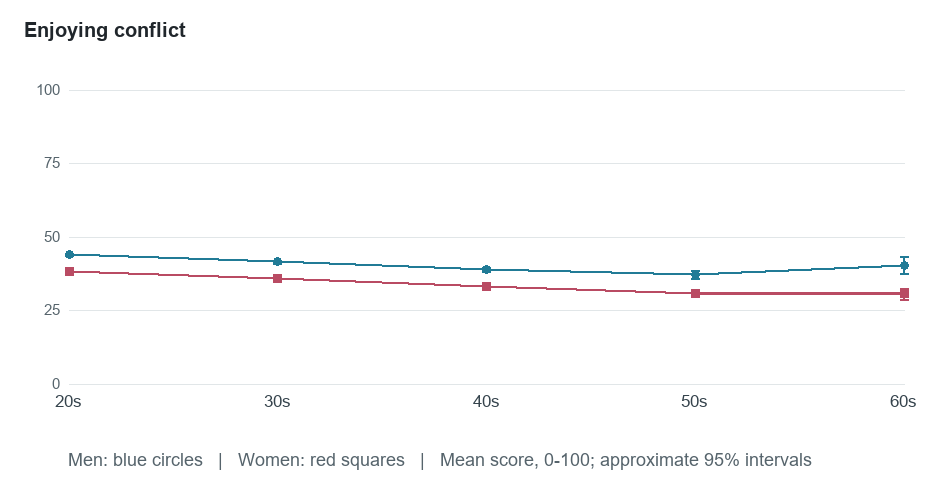
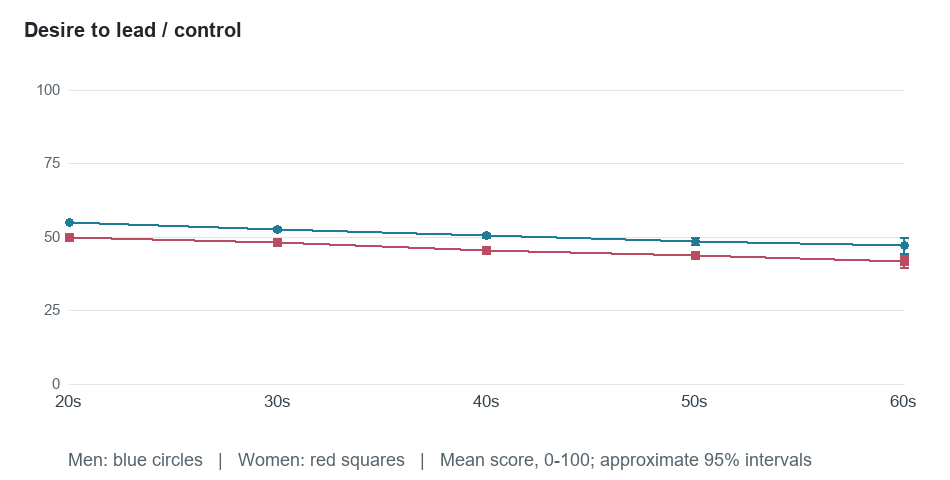
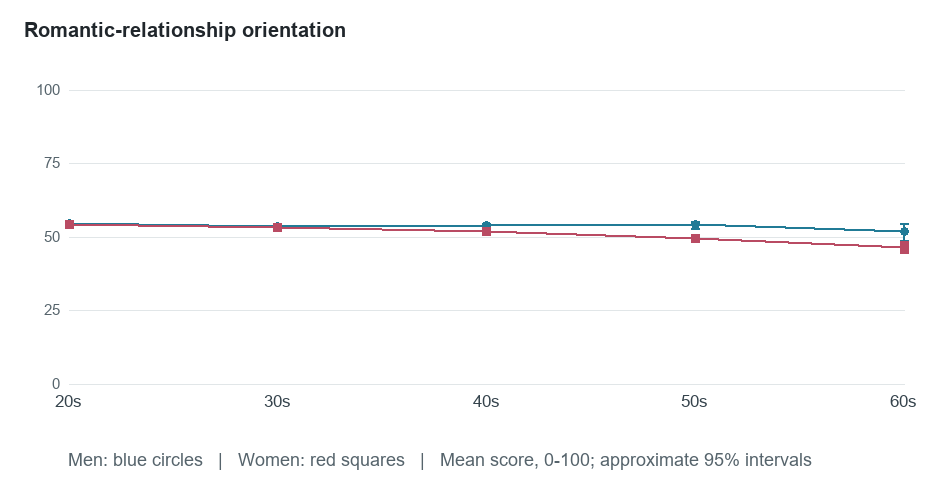
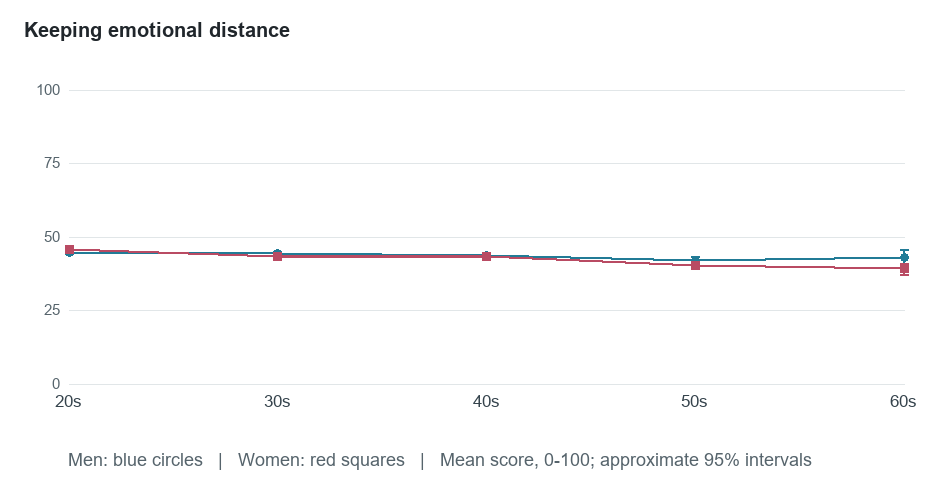
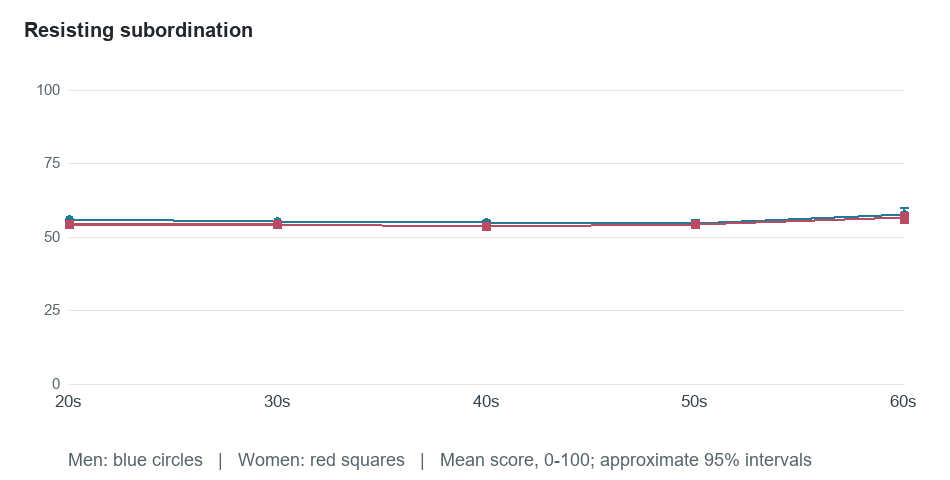
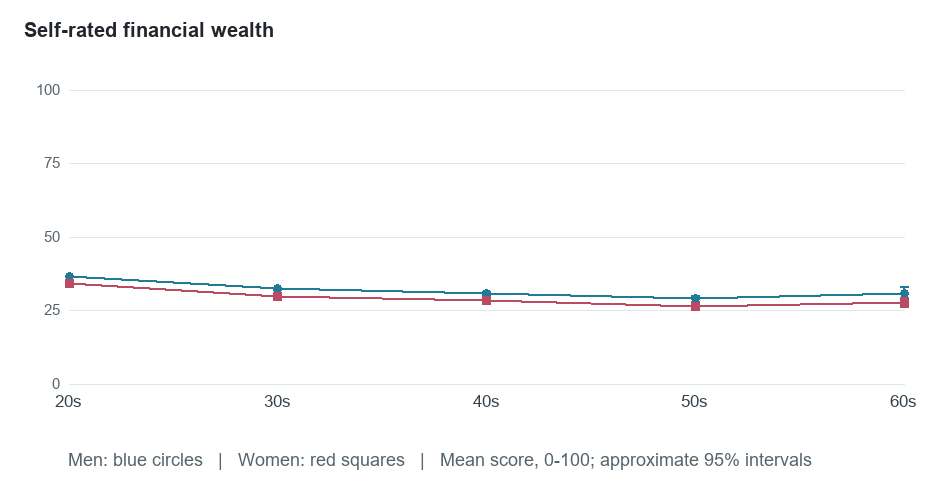
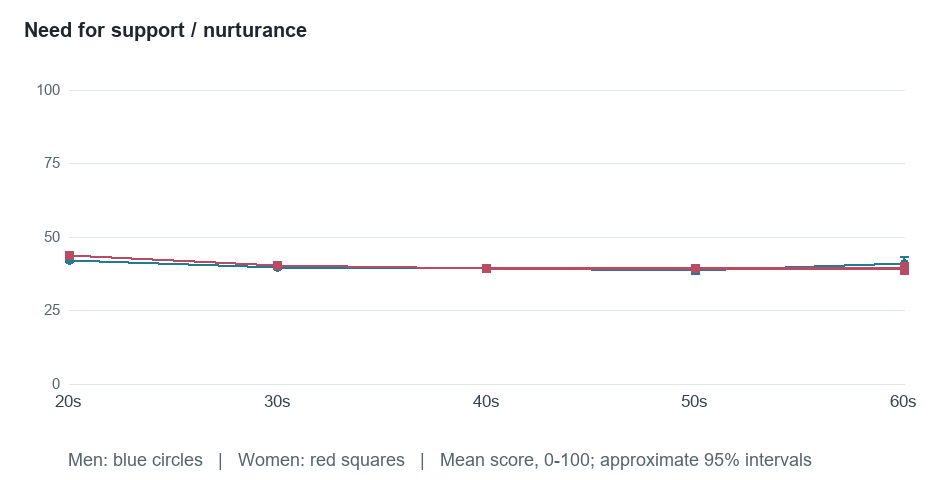
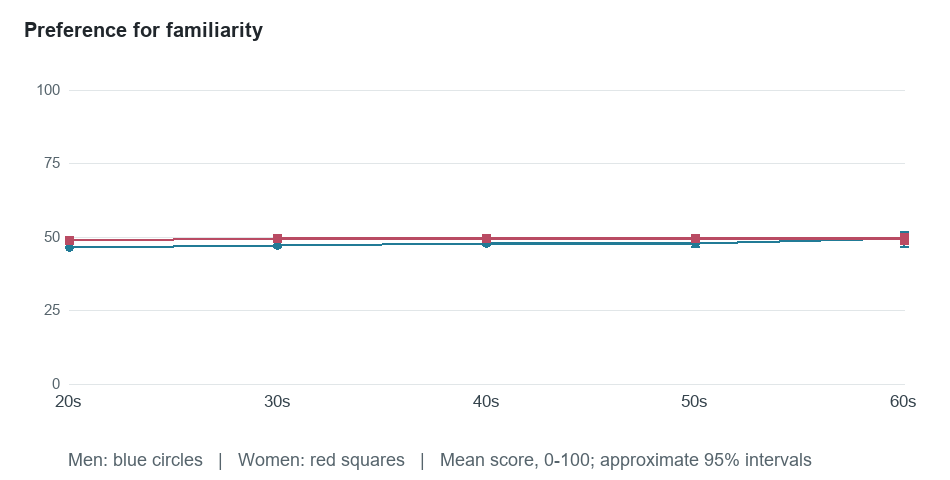
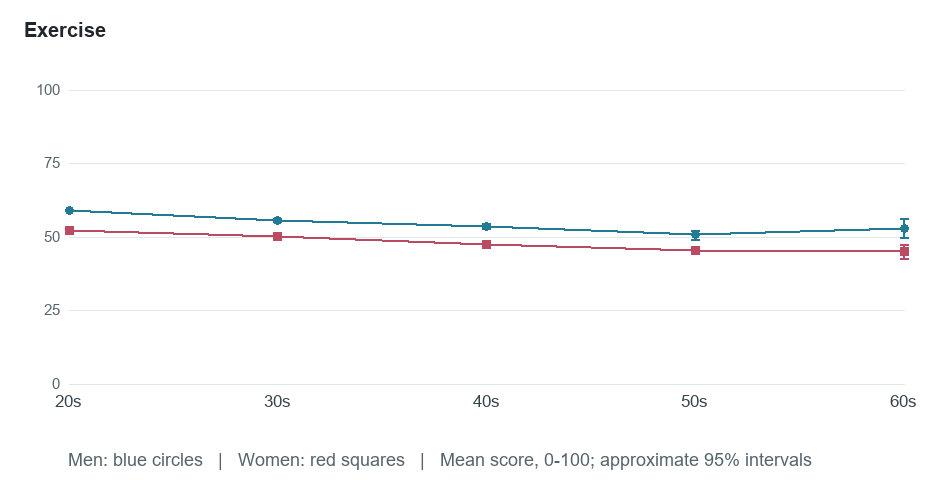
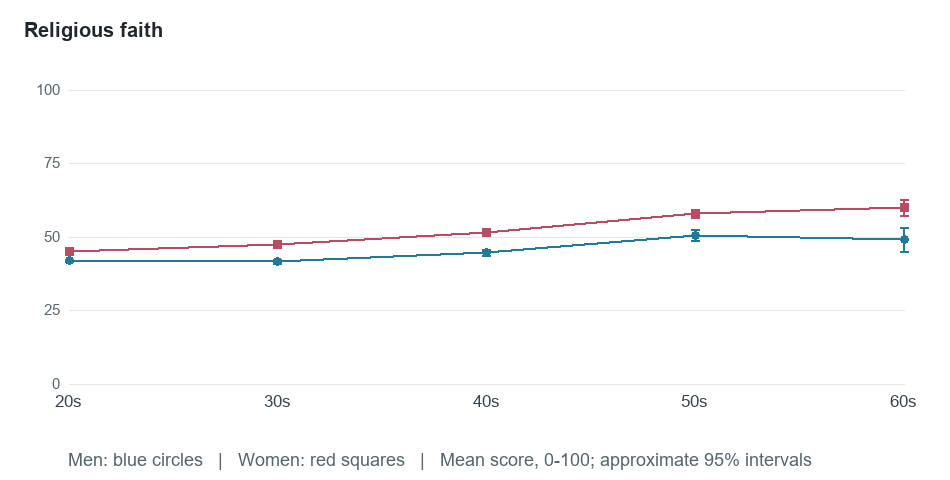
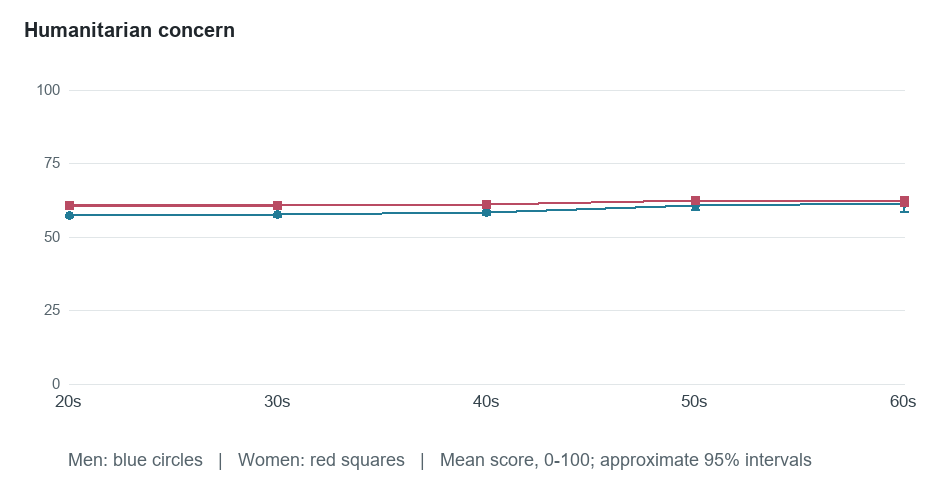
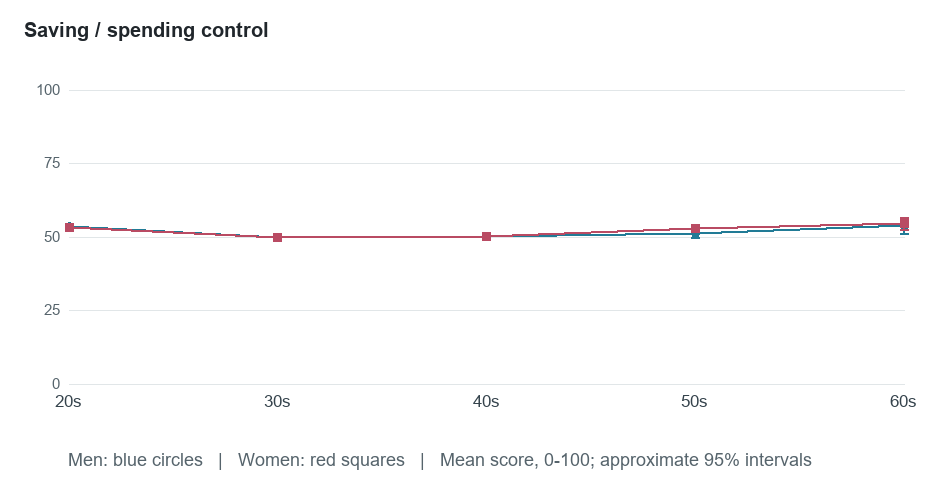
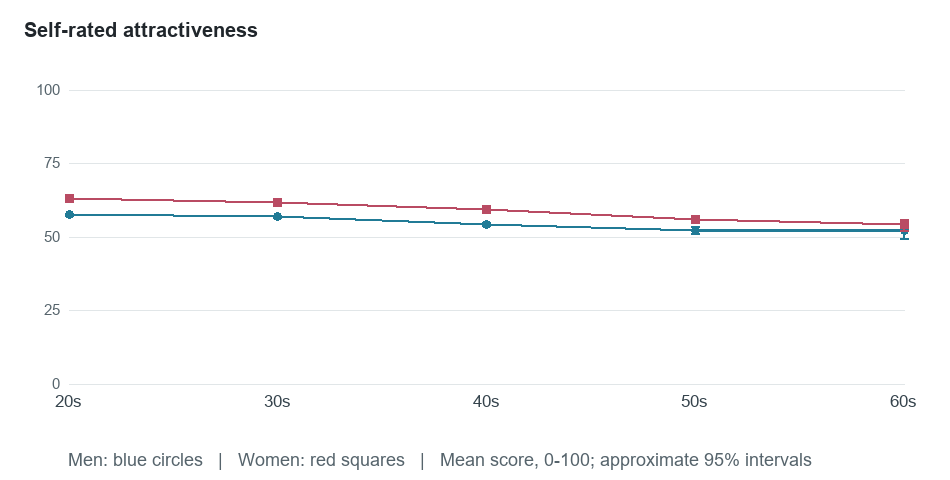
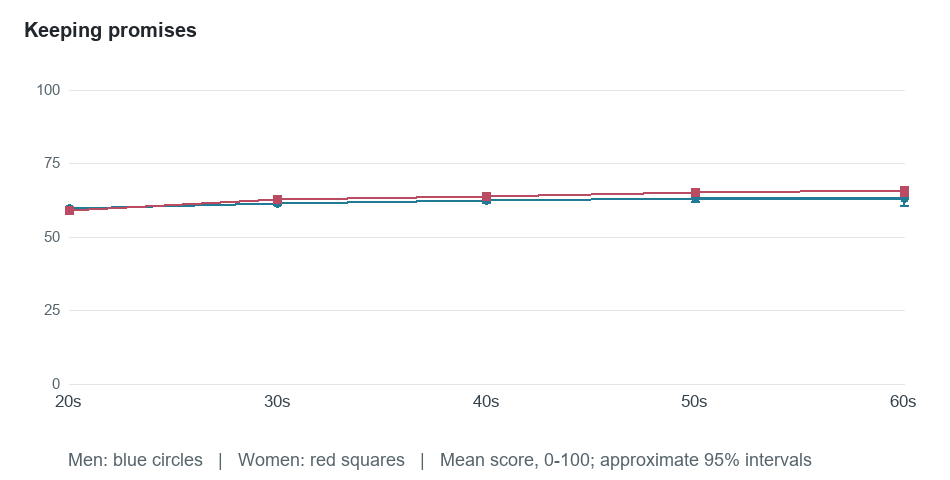
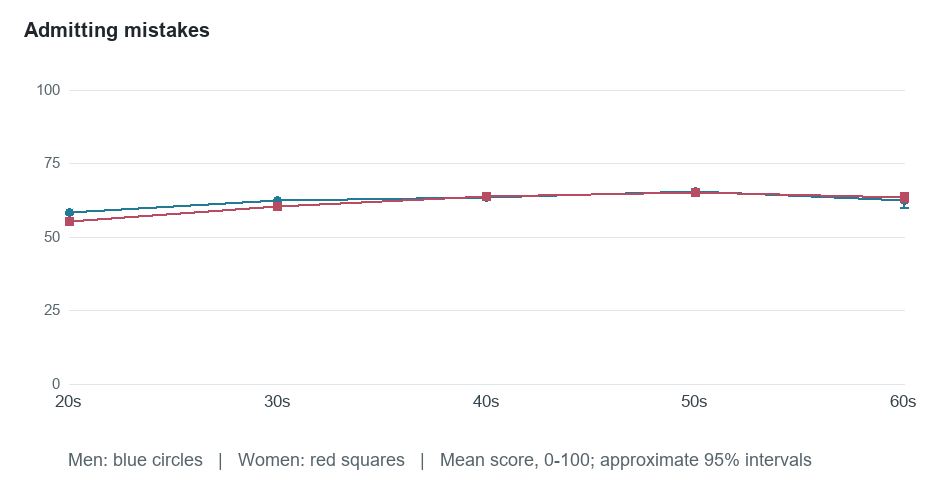
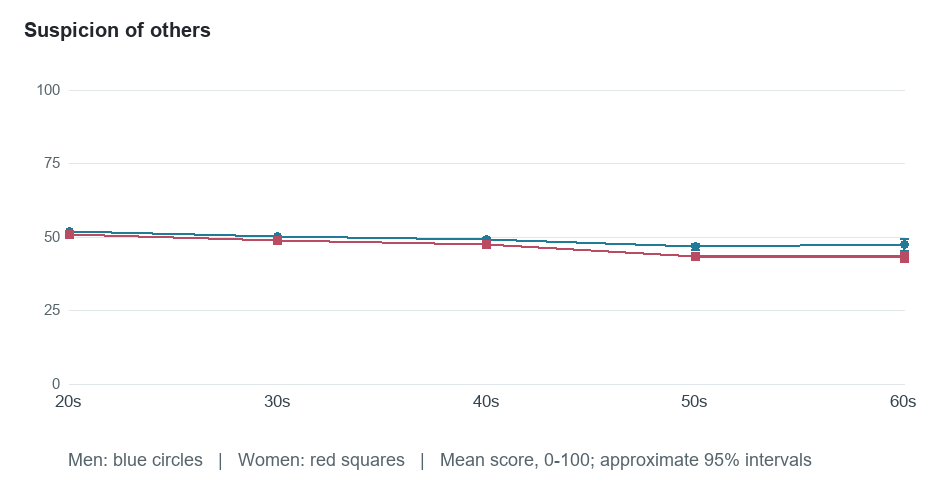
How do personality scores differ between people in their twenties, thirties, forties, fifties and sixties? These comparisons cover all 38 core questionnaire dimensions, with men and women shown separately so that changing gender proportions do not create apparent age trends.
103,554profiles aged 20-69
38questionnaire dimensions
5ten-year age groups
Historical tests: April 26, 2008 to October 19, 2011. Aggregate-only extraction; no names, contact details or individual answers exported.
Age differences are not necessarily aging effects. Each age group contains different people. Generational experiences, who used Facebook, and who chose this test may all contribute. A higher average is not a better or more desirable personality.
The Largest Age-Group Differences
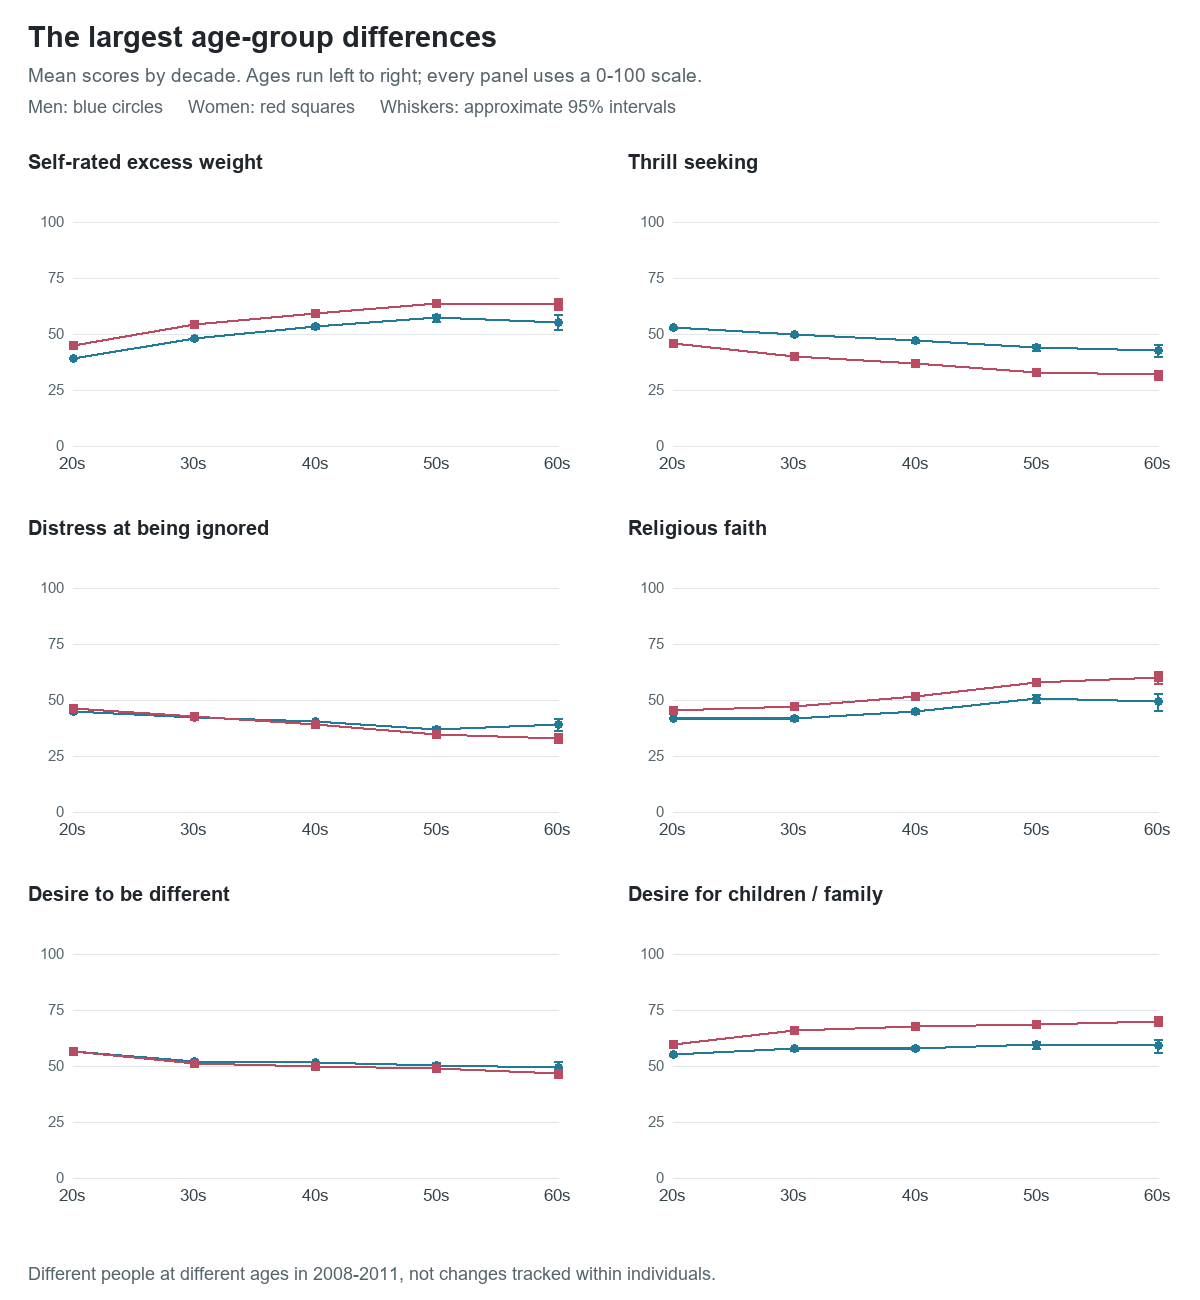
The six charts below are selected by the largest absolute twenties-to-sixties standardized difference in either gender in a fixed discovery half of the data. Full-sample means are plotted; the separate holdout half is reported below as a consistency check.
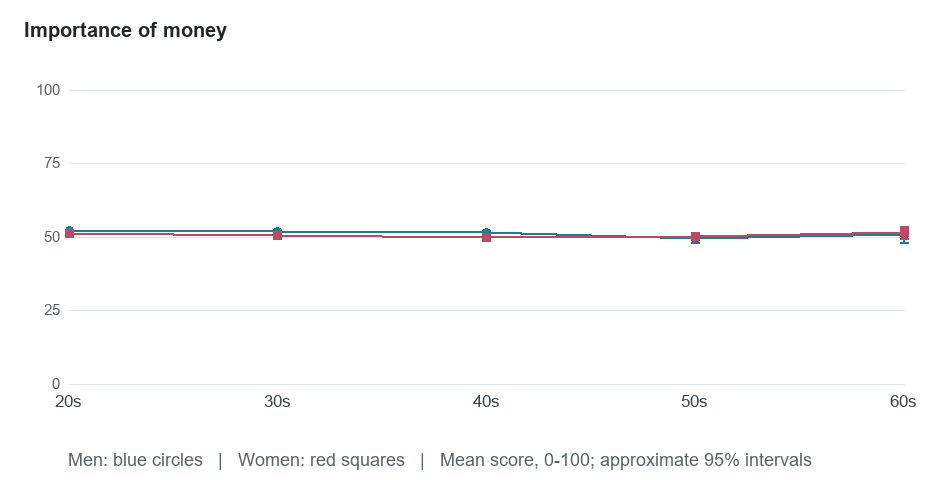
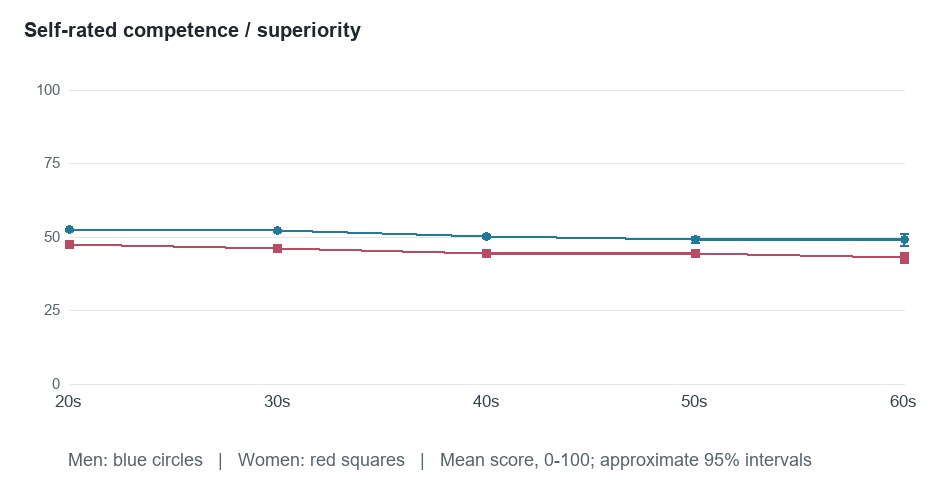
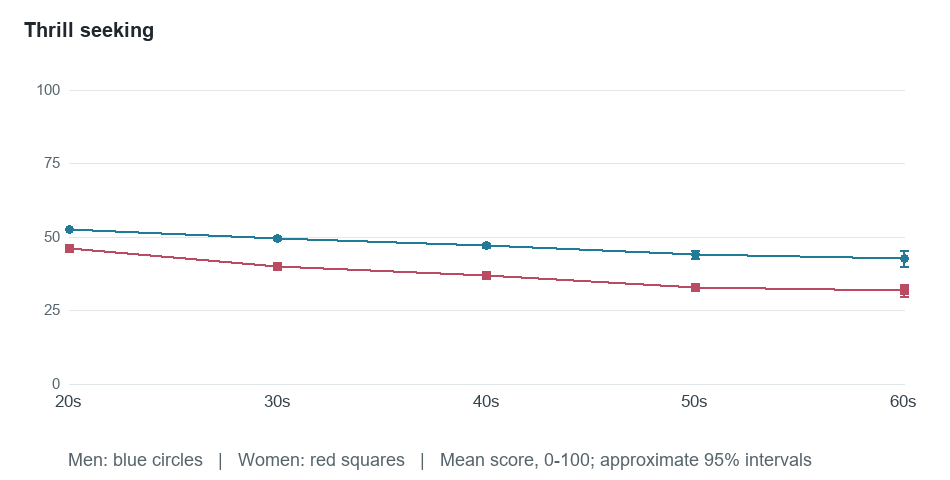
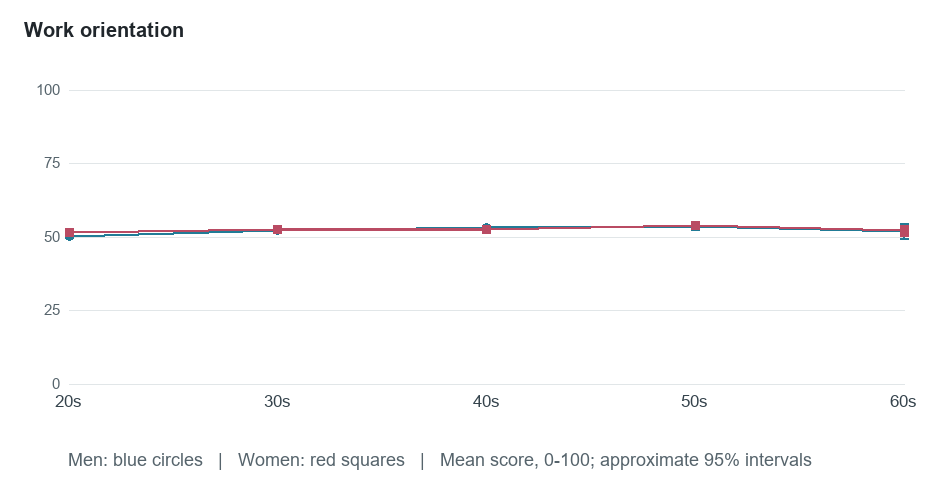
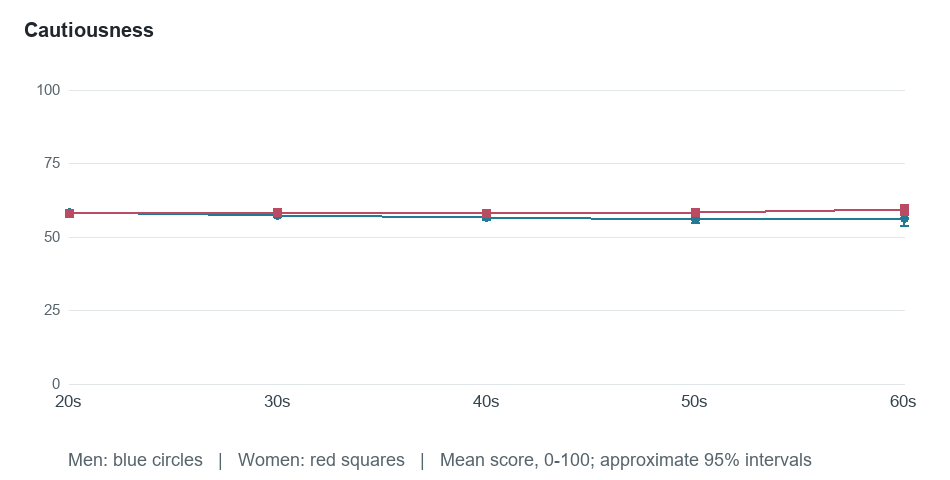
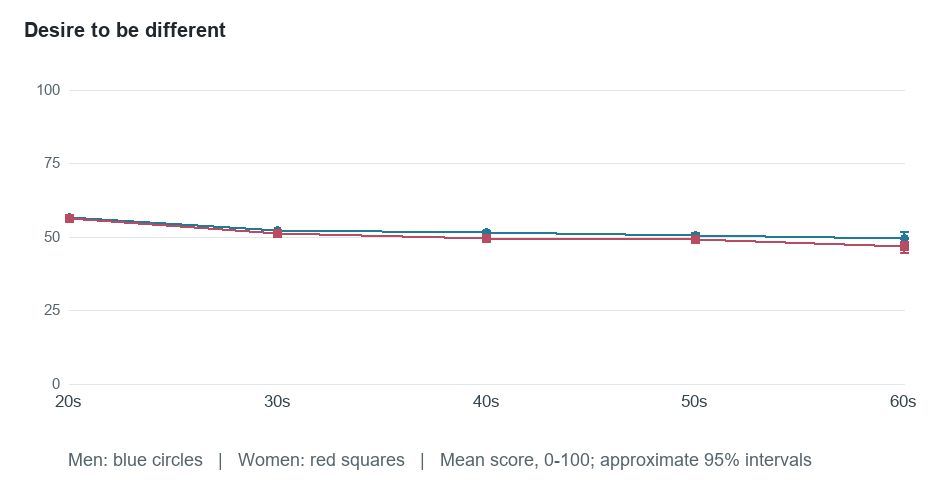
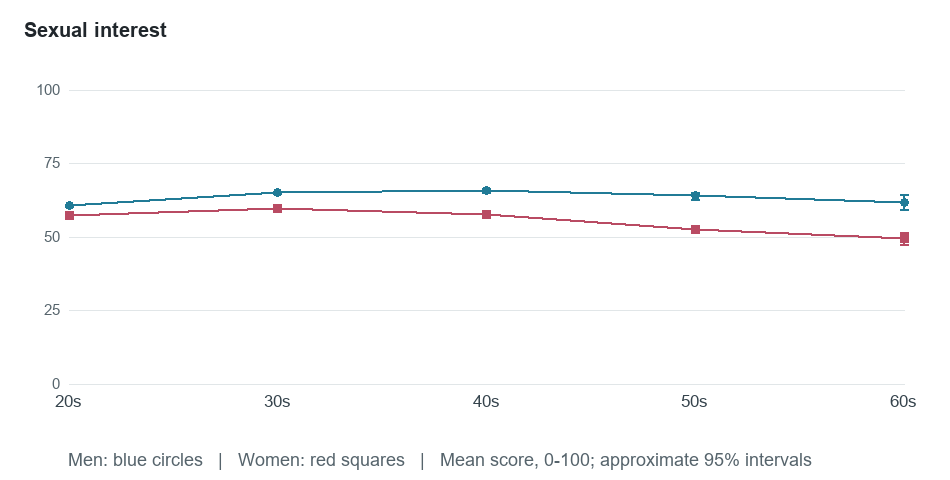
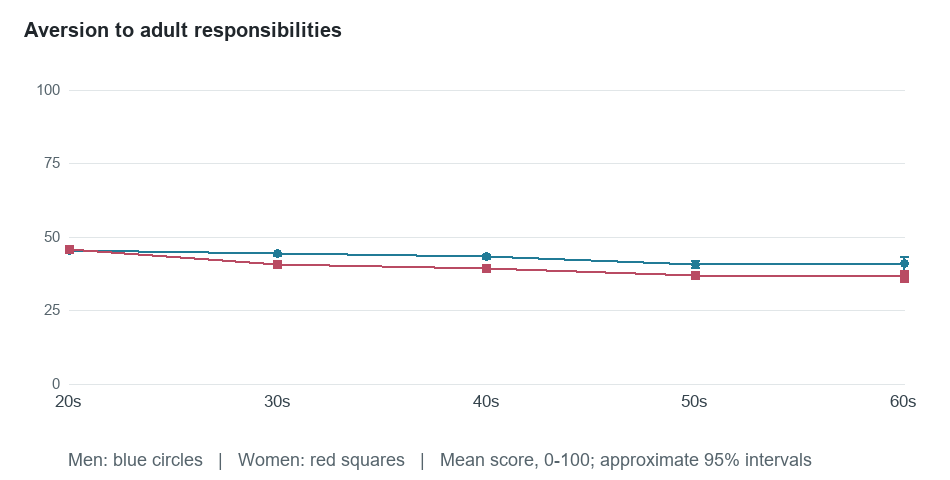
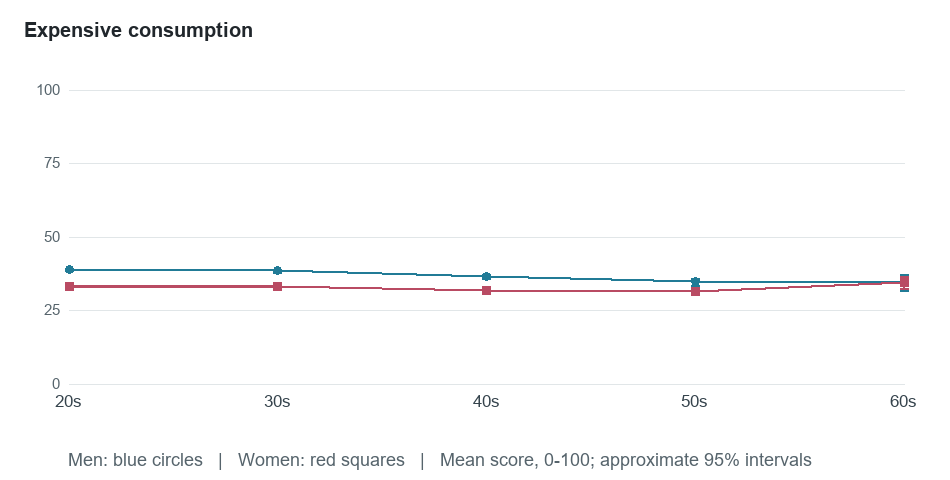
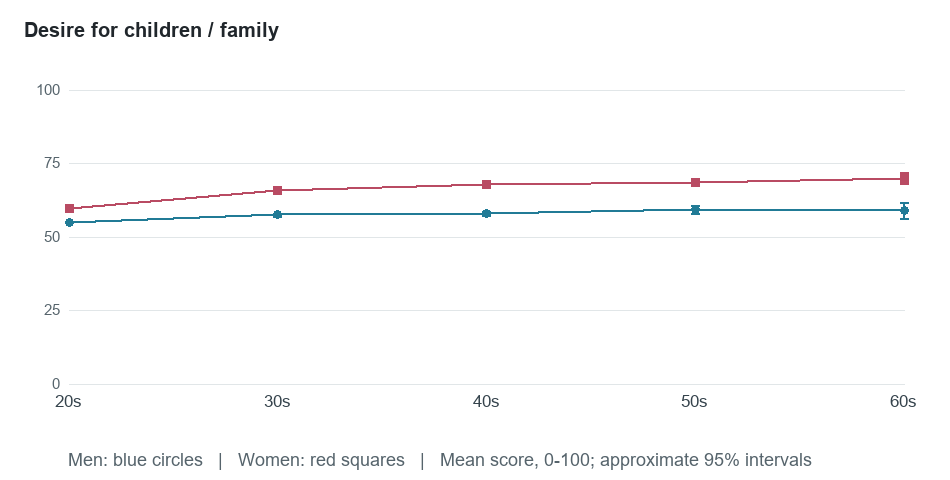
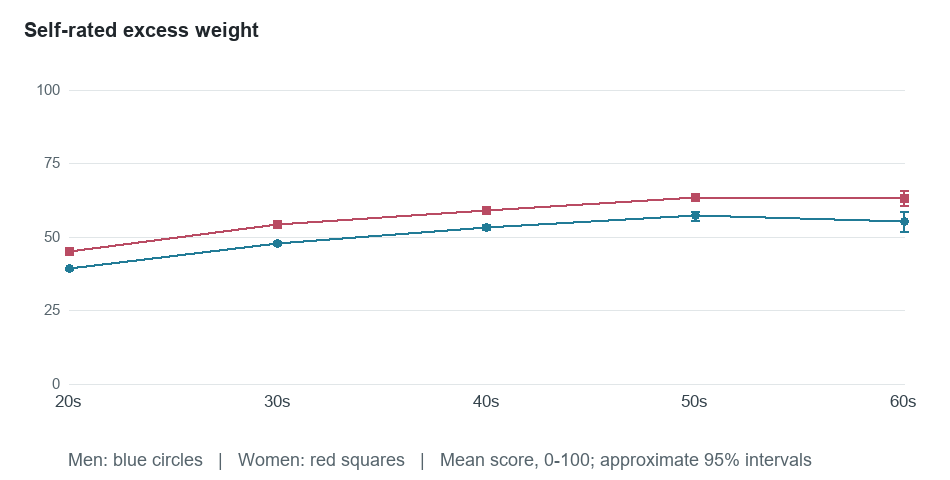
Age runs horizontally in each panel. Blue circles represent men; red squares represent women. All panels use the same 0-100 score scale. Whiskers are approximate 95% intervals for each mean, not the spread of individual people.
Self-rated excess weight
Men average 39.1 in their twenties and 55.2 in their sixties (+16.1 points; +0.64 cohort SD). Women average 45.0 and 63.3 (+18.3 points; +0.69 cohort SD). The intervening decades are shown in the chart and full table, rather than assumed to follow a straight line.
Thrill seeking
Men average 52.7 in their twenties and 42.7 in their sixties (-10.0 points; -0.49 cohort SD). Women average 45.9 and 31.8 (-14.1 points; -0.68 cohort SD). The intervening decades are shown in the chart and full table, rather than assumed to follow a straight line.
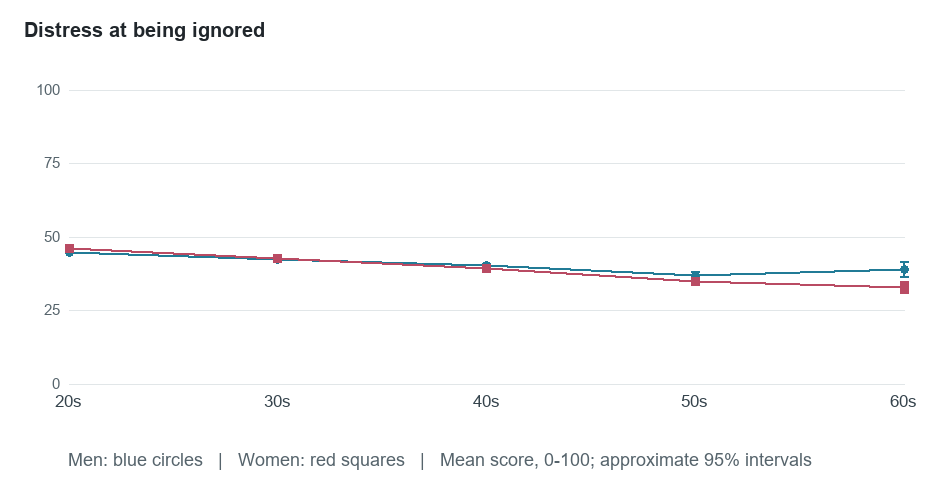
Distress at being ignored
Men average 44.8 in their twenties and 39.0 in their sixties (-5.7 points; -0.29 cohort SD). Women average 46.1 and 33.0 (-13.1 points; -0.65 cohort SD). The intervening decades are shown in the chart and full table, rather than assumed to follow a straight line.
Religious faith
Men average 41.9 in their twenties and 49.1 in their sixties (+7.3 points; +0.24 cohort SD). Women average 45.2 and 60.1 (+14.9 points; +0.50 cohort SD). The intervening decades are shown in the chart and full table, rather than assumed to follow a straight line.
Desire to be different
Men average 56.6 in their twenties and 49.3 in their sixties (-7.3 points; -0.39 cohort SD). Women average 56.3 and 46.6 (-9.7 points; -0.51 cohort SD). The intervening decades are shown in the chart and full table, rather than assumed to follow a straight line.
Desire for children / family
Men average 55.0 in their twenties and 59.0 in their sixties (+3.9 points; +0.19 cohort SD). Women average 59.6 and 70.0 (+10.4 points; +0.47 cohort SD). The intervening decades are shown in the chart and full table, rather than assumed to follow a straight line.
1 contrasts in men and 4 in women meet the descriptive substantial-gap screen: at least 0.50 whole-gender-cohort SD overall, at least 0.40 SD in each half, and consistent direction. These counts concern the twenties-to-sixties contrasts only; all estimates appear below regardless of whether they pass.
Twenties-to-sixties contrasts for every trait
First two numeric columns: score-point gap / whole-cohort SD gap. Last two: discovery / holdout SD gap. Positive means higher scores in the sixties group.
Dimension
Men: points / SD
Women: points / SD
Men: discovery / holdout
Women: discovery / holdout
Self-rated excess weight
+16.1 / +0.64
+18.3 / +0.69
+0.79 / +0.50
+0.67 / +0.71
Thrill seeking
-10.0 / -0.49
-14.1 / -0.68
-0.49 / -0.49
-0.77 / -0.58
Distress at being ignored
-5.7 / -0.29
-13.1 / -0.65
-0.29 / -0.29
-0.63 / -0.67
Religious faith
+7.3 / +0.24
+14.9 / +0.50
+0.15 / +0.33
+0.61 / +0.38
Desire to be different
-7.3 / -0.39
-9.7 / -0.51
-0.38 / -0.40
-0.54 / -0.47
Desire for children / family
+3.9 / +0.19
+10.4 / +0.47
+0.13 / +0.24
+0.53 / +0.40
Aversion to adult responsibilities
-4.5 / -0.23
-9.0 / -0.47
-0.25 / -0.21
-0.49 / -0.45
Desire to lead / control
-7.9 / -0.39
-8.1 / -0.40
-0.48 / -0.31
-0.41 / -0.38
Self-rated attractiveness
-5.6 / -0.30
-8.9 / -0.48
-0.34 / -0.26
-0.47 / -0.50
Suspicion of others
-4.3 / -0.24
-7.5 / -0.42
-0.19 / -0.29
-0.47 / -0.35
Self-rated financial wealth
-5.8 / -0.33
-6.5 / -0.37
-0.41 / -0.25
-0.45 / -0.27
Admitting mistakes
+4.1 / +0.23
+8.2 / +0.46
+0.26 / +0.19
+0.45 / +0.47
Putting others first
+4.4 / +0.25
+6.7 / +0.40
+0.16 / +0.34
+0.44 / +0.34
Enjoying conflict
-3.5 / -0.17
-7.7 / -0.39
-0.09 / -0.25
-0.44 / -0.35
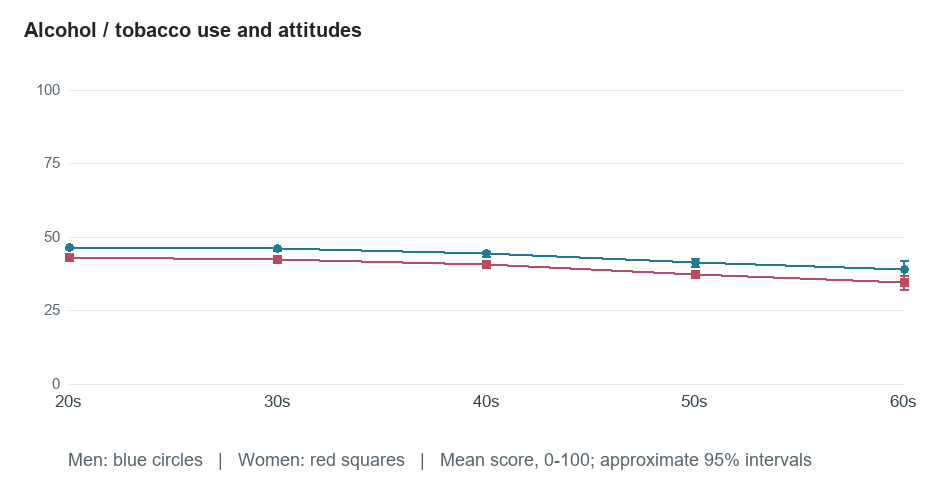
Alcohol / tobacco use and attitudes
-7.7 / -0.32
-8.6 / -0.37
-0.29 / -0.35
-0.42 / -0.31
Sexual interest
+1.2 / +0.06
-7.7 / -0.39
+0.13 / -0.00
-0.41 / -0.36
Keeping promises
+3.5 / +0.20
+6.5 / +0.39
+0.16 / +0.25
+0.40 / +0.37
Romantic-relationship orientation
-2.8 / -0.14
-7.6 / -0.38
-0.15 / -0.13
-0.38 / -0.38
Keeping emotional distance
-1.8 / -0.09
-6.6 / -0.32
-0.06 / -0.12
-0.38 / -0.25
Intellectual interests
-1.8 / -0.10
-4.0 / -0.23
-0.06 / -0.14
-0.36 / -0.09
Exercise
-6.2 / -0.28
-7.2 / -0.31
-0.30 / -0.25
-0.35 / -0.26
Self-rated competence / superiority
-3.1 / -0.18
-4.4 / -0.25
-0.15 / -0.22
-0.33 / -0.16
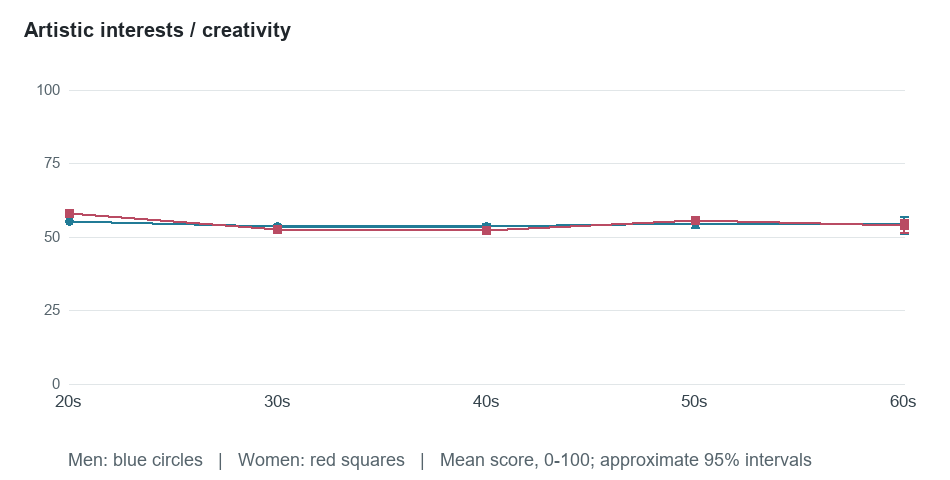
Artistic interests / creativity
-1.2 / -0.05
-4.4 / -0.18
-0.08 / -0.02
-0.28 / -0.07
Mystical / paranormal orientation
-5.0 / -0.22
-1.7 / -0.08
-0.28 / -0.17
-0.15 / +0.01
Emotional calm
-0.5 / -0.03
+5.5 / +0.30
-0.07 / +0.02
+0.27 / +0.33
Expensive consumption
-4.4 / -0.22
+1.3 / +0.07
-0.25 / -0.19
+0.05 / +0.09
Orderliness
+3.6 / +0.20
+4.3 / +0.23
+0.18 / +0.22
+0.24 / +0.22
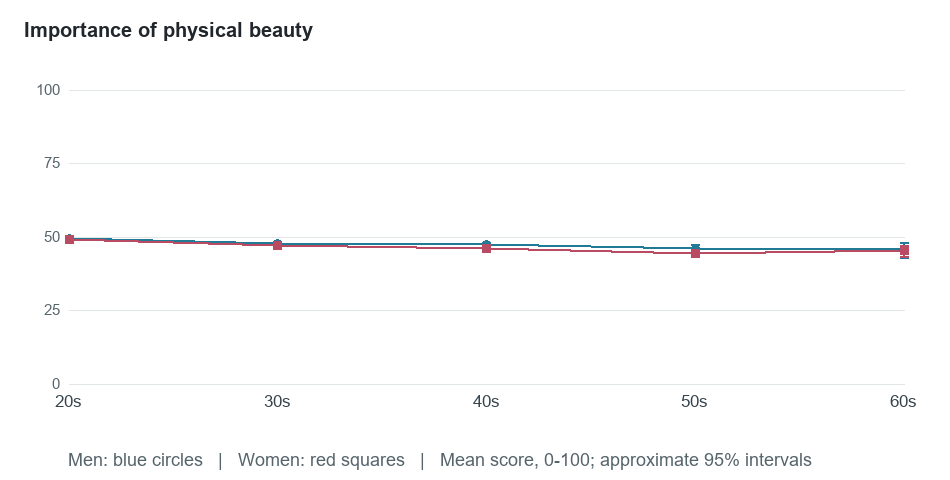
Importance of physical beauty
-4.1 / -0.22
-4.0 / -0.21
-0.23 / -0.21
-0.23 / -0.19
Humanitarian concern
+4.1 / +0.21
+1.4 / +0.08
+0.23 / +0.19
+0.11 / +0.04
Disclosure / outgoingness
+2.4 / +0.13
+4.3 / +0.23
+0.08 / +0.18
+0.23 / +0.24
Resisting subordination
+1.8 / +0.10
+2.3 / +0.13
+0.20 / -0.00
+0.08 / +0.18
Need for support / nurturance
-1.0 / -0.05
-4.3 / -0.24
-0.02 / -0.09
-0.20 / -0.28
Cautiousness
-2.2 / -0.12
+1.3 / +0.08
-0.16 / -0.09
+0.09 / +0.05
Importance of money
-1.4 / -0.06
+0.3 / +0.02
-0.13 / -0.00
+0.01 / +0.02
Saving / spending control
+0.5 / +0.02
+1.4 / +0.07
+0.09 / -0.04
+0.08 / +0.05
Work orientation
+1.8 / +0.09
+0.6 / +0.03
+0.01 / +0.18
+0.07 / -0.01
Preference for familiarity
+2.8 / +0.16
+0.7 / +0.04
+0.05 / +0.26
+0.06 / +0.02
Accepting help
-0.9 / -0.04
+0.4 / +0.02
-0.05 / -0.04
+0.04 / -0.00
Where Are the Biggest Adjacent-Decade Gaps?
Endpoints can hide curves or plateaus. These are the strongest adjacent-decade differences across all 38 traits and both genders, ranked by the discovery-half absolute standardized gap. One contrast per trait is shown to avoid repeating the same dimension. Smaller groups in later decades make their estimates less stable.
Dimension
Gender
Age groups
Full gap
Cohort SD
Discovery gap
Holdout gap
Self-rated excess weight
Men
20-29 to 30-39
+8.8
+0.35
+9.0
+8.7
Desire for children / family
Women
20-29 to 30-39
+6.2
+0.28
+6.6
+5.8
Admitting mistakes
Women
20-29 to 30-39
+5.1
+0.28
+5.1
+5.2
Putting others first
Women
20-29 to 30-39
+4.5
+0.26
+4.7
+4.2
Thrill seeking
Women
20-29 to 30-39
-5.9
-0.28
-5.7
-6.0
Resisting subordination
Men
50-59 to 60-69
+2.9
+0.16
+5.1
+0.8
Desire to be different
Women
20-29 to 30-39
-5.3
-0.28
-5.0
-5.6
Distress at being ignored
Women
40-49 to 50-59
-4.4
-0.22
-5.2
-3.5
Aversion to adult responsibilities
Women
20-29 to 30-39
-5.0
-0.26
-4.9
-5.2
Sexual interest
Men
20-29 to 30-39
+4.5
+0.24
+4.7
+4.3
Suspicion of others
Women
40-49 to 50-59
-4.0
-0.22
-4.4
-3.6
Self-rated financial wealth
Men
20-29 to 30-39
-4.2
-0.24
-4.2
-4.1
These are differences between group means, not the amount an individual changes over ten years. The holdout check uses the same historical source and is not an external replication.
All 38 Traits, Decade by Decade
Every trait appears in the original questionnaire order. Expand a trait for its age chart and all ten gender-by-age-group means. Scores are on a 0-100 questionnaire scale, not population percentiles.
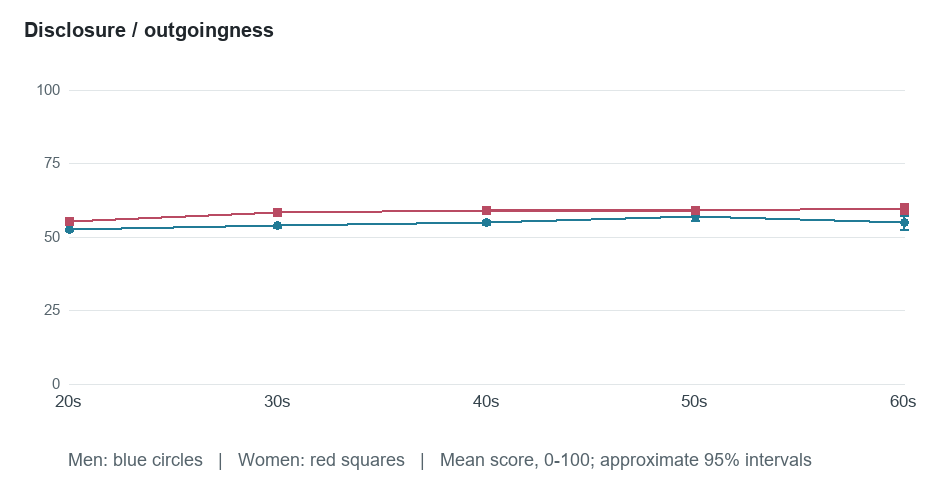
Disclosure / outgoingness
Age group
Men: n
Men: mean
Men: approx. 95% CI
Women: n
Women: mean
Women: approx. 95% CI
Women minus men
20-29
29,805
52.4
52.2 to 52.6
41,546
55.4
55.2 to 55.6
+3.0
30-39
6,988
53.7
53.3 to 54.2
12,663
58.3
58.0 to 58.6
+4.5
40-49
3,060
55.0
54.4 to 55.7
5,853
59.1
58.6 to 59.5
+4.1
50-59
953
56.8
55.7 to 58.0
2,076
58.9
58.1 to 59.6
+2.0
60-69
223
54.8
52.4 to 57.2
387
59.7
57.9 to 61.4
+4.9
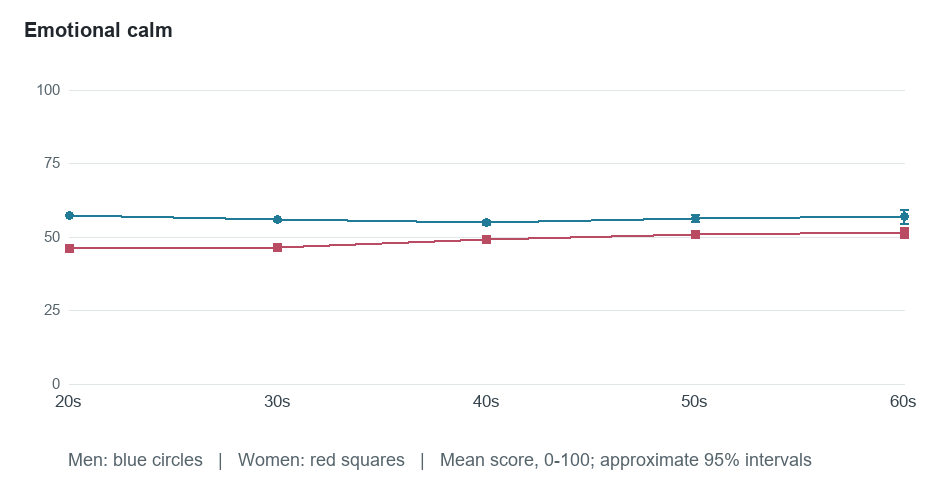
Emotional calm
Age group
Men: n
Men: mean
Men: approx. 95% CI
Women: n
Women: mean
Women: approx. 95% CI
Women minus men
20-29
29,805
57.4
57.2 to 57.6
41,546
46.0
45.8 to 46.2
-11.4
30-39
6,988
55.9
55.5 to 56.3
12,663
46.4
46.1 to 46.7
-9.5
40-49
3,060
55.1
54.4 to 55.7
5,853
49.0
48.5 to 49.5
-6.1
50-59
953
56.3
55.2 to 57.5
2,076
50.9
50.1 to 51.6
-5.5
60-69
223
56.9
54.6 to 59.3
387
51.5
49.7 to 53.2
-5.5
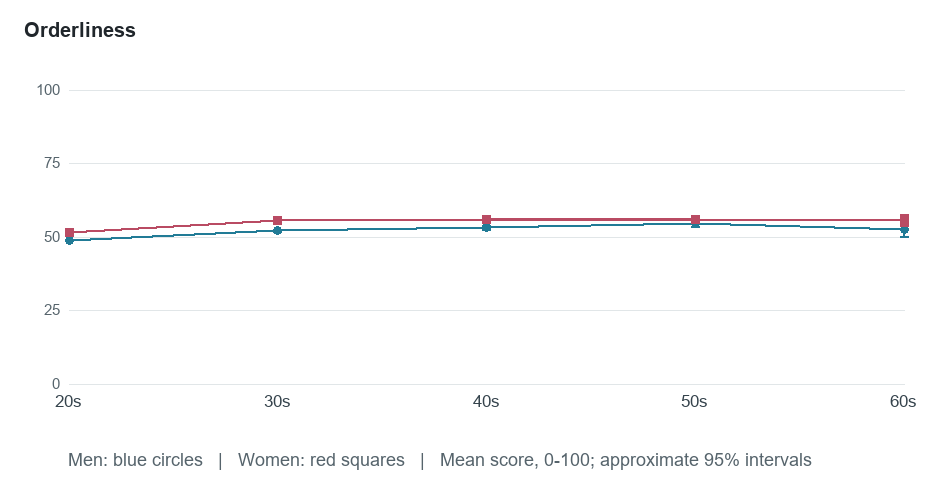
Orderliness
Age group
Men: n
Men: mean
Men: approx. 95% CI
Women: n
Women: mean
Women: approx. 95% CI
Women minus men
20-29
29,805
49.0
48.8 to 49.2
41,546
51.4
51.2 to 51.6
+2.5
30-39
6,988
52.2
51.7 to 52.6
12,663
55.5
55.2 to 55.8
+3.3
40-49
3,060
53.3
52.6 to 53.9
5,853
55.9
55.4 to 56.4
+2.6
50-59
953
54.6
53.5 to 55.7
2,076
56.0
55.2 to 56.7
+1.4
60-69
223
52.6
50.3 to 54.9
387
55.7
53.9 to 57.5
+3.1
Putting others first
Age group
Men: n
Men: mean
Men: approx. 95% CI
Women: n
Women: mean
Women: approx. 95% CI
Women minus men
20-29
29,805
56.4
56.2 to 56.6
41,546
59.6
59.5 to 59.8
+3.3
30-39
6,988
58.3
57.9 to 58.7
12,663
64.1
63.8 to 64.4
+5.8
40-49
3,060
60.2
59.6 to 60.8
5,853
66.1
65.7 to 66.5
+5.9
50-59
953
62.6
61.5 to 63.6
2,076
66.7
66.1 to 67.3
+4.2
60-69
223
60.8
58.7 to 62.9
387
66.4
64.8 to 68.0
+5.6
Intellectual interests
Age group
Men: n
Men: mean
Men: approx. 95% CI
Women: n
Women: mean
Women: approx. 95% CI
Women minus men
20-29
29,805
58.0
57.8 to 58.2
41,546
50.2
50.0 to 50.3
-7.9
30-39
6,988
57.0
56.6 to 57.5
12,663
48.1
47.8 to 48.4
-8.9
40-49
3,060
55.2
54.5 to 55.8
5,853
46.3
45.9 to 46.8
-8.8
50-59
953
54.3
53.1 to 55.5
2,076
46.7
46.0 to 47.5
-7.6
60-69
223
56.2
53.7 to 58.7
387
46.2
44.5 to 47.9
-10.0
Accepting help
Age group
Men: n
Men: mean
Men: approx. 95% CI
Women: n
Women: mean
Women: approx. 95% CI
Women minus men
20-29
29,805
52.1
51.9 to 52.3
41,546
53.0
52.8 to 53.2
+0.9
30-39
6,988
51.3
50.8 to 51.8
12,663
50.5
50.1 to 50.8
-0.8
40-49
3,060
50.6
50.0 to 51.3
5,853
50.1
49.5 to 50.6
-0.6
50-59
953
52.2
51.0 to 53.5
2,076
51.3
50.4 to 52.1
-0.9
60-69
223
51.2
48.6 to 53.8
387
53.4
51.4 to 55.4
+2.2
Mystical / paranormal orientation
Age group
Men: n
Men: mean
Men: approx. 95% CI
Women: n
Women: mean
Women: approx. 95% CI
Women minus men
20-29
29,805
46.6
46.4 to 46.9
41,546
46.2
46.0 to 46.4
-0.4
30-39
6,988
45.2
44.7 to 45.8
12,663
45.9
45.5 to 46.3
+0.7
40-49
3,060
43.9
43.0 to 44.7
5,853
45.6
45.0 to 46.2
+1.8
50-59
953
42.6
41.2 to 44.1
2,076
45.8
44.8 to 46.8
+3.2
60-69
223
41.6
38.5 to 44.7
387
44.5
42.2 to 46.9
+2.9
Importance of money
Age group
Men: n
Men: mean
Men: approx. 95% CI
Women: n
Women: mean
Women: approx. 95% CI
Women minus men
20-29
29,805
52.1
51.9 to 52.4
41,546
51.1
50.9 to 51.3
-1.0
30-39
6,988
52.0
51.5 to 52.5
12,663
50.6
50.3 to 51.0
-1.4
40-49
3,060
51.6
50.9 to 52.3
5,853
49.8
49.3 to 50.3
-1.8
50-59
953
49.5
48.3 to 50.8
2,076
50.0
49.2 to 50.9
+0.5
60-69
223
50.7
48.0 to 53.5
387
51.5
49.4 to 53.5
+0.7
Self-rated competence / superiority
Age group
Men: n
Men: mean
Men: approx. 95% CI
Women: n
Women: mean
Women: approx. 95% CI
Women minus men
20-29
29,805
52.4
52.2 to 52.6
41,546
47.5
47.3 to 47.6
-5.0
30-39
6,988
52.1
51.7 to 52.5
12,663
46.1
45.8 to 46.4
-6.0
40-49
3,060
50.3
49.7 to 50.8
5,853
44.5
44.0 to 44.9
-5.8
50-59
953
49.0
48.0 to 50.1
2,076
44.4
43.7 to 45.1
-4.6
60-69
223
49.3
47.2 to 51.3
387
43.1
41.4 to 44.8
-6.2
Thrill seeking
Age group
Men: n
Men: mean
Men: approx. 95% CI
Women: n
Women: mean
Women: approx. 95% CI
Women minus men
20-29
29,805
52.7
52.5 to 52.9
41,546
45.9
45.7 to 46.1
-6.8
30-39
6,988
49.6
49.1 to 50.1
12,663
40.1
39.7 to 40.4
-9.5
40-49
3,060
47.0
46.3 to 47.7
5,853
36.9
36.4 to 37.4
-10.1
50-59
953
44.0
42.7 to 45.3
2,076
32.7
31.9 to 33.6
-11.3
60-69
223
42.7
39.9 to 45.5
387
31.8
29.8 to 33.8
-10.9
Work orientation
Age group
Men: n
Men: mean
Men: approx. 95% CI
Women: n
Women: mean
Women: approx. 95% CI
Women minus men
20-29
29,805
50.2
49.9 to 50.4
41,546
51.6
51.5 to 51.8
+1.5
30-39
6,988
52.1
51.6 to 52.5
12,663
52.7
52.4 to 53.0
+0.6
40-49
3,060
53.2
52.6 to 53.9
5,853
52.5
52.0 to 53.0
-0.7
50-59
953
53.7
52.6 to 54.9
2,076
53.8
53.0 to 54.6
+0.0
60-69
223
52.0
49.4 to 54.5
387
52.3
50.5 to 54.0
+0.3
Enjoying conflict
Age group
Men: n
Men: mean
Men: approx. 95% CI
Women: n
Women: mean
Women: approx. 95% CI
Women minus men
20-29
29,805
44.0
43.7 to 44.2
41,546
38.4
38.2 to 38.6
-5.6
30-39
6,988
41.6
41.2 to 42.1
12,663
35.8
35.5 to 36.2
-5.8
40-49
3,060
39.0
38.3 to 39.7
5,853
33.0
32.6 to 33.5
-5.9
50-59
953
37.3
36.0 to 38.5
2,076
30.7
29.9 to 31.4
-6.6
60-69
223
40.4
37.6 to 43.3
387
30.6
28.9 to 32.4
-9.8
Desire to lead / control
Age group
Men: n
Men: mean
Men: approx. 95% CI
Women: n
Women: mean
Women: approx. 95% CI
Women minus men
20-29
29,805
55.0
54.8 to 55.2
41,546
49.8
49.6 to 50.0
-5.2
30-39
6,988
52.7
52.2 to 53.2
12,663
48.0
47.7 to 48.4
-4.7
40-49
3,060
50.6
49.9 to 51.3
5,853
45.5
44.9 to 46.0
-5.1
50-59
953
48.6
47.4 to 49.9
2,076
43.7
42.8 to 44.6
-5.0
60-69
223
47.1
44.4 to 49.8
387
41.7
39.7 to 43.7
-5.4
Romantic-relationship orientation
Age group
Men: n
Men: mean
Men: approx. 95% CI
Women: n
Women: mean
Women: approx. 95% CI
Women minus men
20-29
29,805
54.6
54.3 to 54.8
41,546
54.2
54.0 to 54.4
-0.4
30-39
6,988
53.5
53.1 to 54.0
12,663
53.1
52.8 to 53.5
-0.4
40-49
3,060
53.8
53.1 to 54.5
5,853
52.0
51.5 to 52.5
-1.8
50-59
953
54.2
52.9 to 55.4
2,076
49.4
48.5 to 50.2
-4.8
60-69
223
51.8
49.0 to 54.6
387
46.5
44.6 to 48.5
-5.3
Keeping emotional distance
Age group
Men: n
Men: mean
Men: approx. 95% CI
Women: n
Women: mean
Women: approx. 95% CI
Women minus men
20-29
29,805
44.7
44.4 to 44.9
41,546
45.8
45.6 to 46.0
+1.1
30-39
6,988
44.5
44.0 to 44.9
12,663
43.5
43.1 to 43.8
-1.0
40-49
3,060
43.8
43.1 to 44.5
5,853
43.3
42.8 to 43.8
-0.5
50-59
953
42.1
40.8 to 43.4
2,076
40.4
39.6 to 41.3
-1.7
60-69
223
42.9
40.1 to 45.7
387
39.2
37.2 to 41.2
-3.7
Resisting subordination
Age group
Men: n
Men: mean
Men: approx. 95% CI
Women: n
Women: mean
Women: approx. 95% CI
Women minus men
20-29
29,805
55.8
55.6 to 56.0
41,546
54.3
54.2 to 54.5
-1.5
30-39
6,988
55.3
54.9 to 55.8
12,663
54.3
54.0 to 54.6
-1.0
40-49
3,060
54.9
54.2 to 55.5
5,853
53.6
53.1 to 54.0
-1.3
50-59
953
54.7
53.5 to 56.0
2,076
54.2
53.4 to 55.0
-0.5
60-69
223
57.6
55.1 to 60.2
387
56.6
54.8 to 58.4
-1.0
Self-rated financial wealth
Age group
Men: n
Men: mean
Men: approx. 95% CI
Women: n
Women: mean
Women: approx. 95% CI
Women minus men
20-29
29,805
36.6
36.4 to 36.8
41,546
34.2
34.1 to 34.4
-2.4
30-39
6,988
32.5
32.1 to 32.9
12,663
29.8
29.5 to 30.1
-2.7
40-49
3,060
30.9
30.3 to 31.5
5,853
28.4
28.0 to 28.8
-2.5
50-59
953
29.0
28.0 to 30.1
2,076
26.4
25.7 to 27.0
-2.7
60-69
223
30.8
28.6 to 33.1
387
27.7
26.2 to 29.3
-3.1
Need for support / nurturance
Age group
Men: n
Men: mean
Men: approx. 95% CI
Women: n
Women: mean
Women: approx. 95% CI
Women minus men
20-29
29,805
41.8
41.6 to 42.0
41,546
43.7
43.5 to 43.9
+1.9
30-39
6,988
39.7
39.3 to 40.1
12,663
40.4
40.1 to 40.7
+0.6
40-49
3,060
39.1
38.5 to 39.8
5,853
39.3
38.8 to 39.7
+0.1
50-59
953
38.7
37.5 to 39.8
2,076
39.4
38.6 to 40.1
+0.7
60-69
223
40.9
38.3 to 43.4
387
39.4
37.6 to 41.2
-1.5
Preference for familiarity
Age group
Men: n
Men: mean
Men: approx. 95% CI
Women: n
Women: mean
Women: approx. 95% CI
Women minus men
20-29
29,805
46.6
46.4 to 46.8
41,546
48.8
48.6 to 49.0
+2.2
30-39
6,988
47.1
46.7 to 47.6
12,663
49.5
49.2 to 49.8
+2.3
40-49
3,060
47.9
47.3 to 48.6
5,853
49.6
49.1 to 50.1
+1.7
50-59
953
47.8
46.7 to 48.9
2,076
49.6
48.8 to 50.3
+1.8
60-69
223
49.3
46.8 to 51.8
387
49.5
47.7 to 51.3
+0.2
Cautiousness
Age group
Men: n
Men: mean
Men: approx. 95% CI
Women: n
Women: mean
Women: approx. 95% CI
Women minus men
20-29
29,805
58.3
58.1 to 58.5
41,546
58.0
57.8 to 58.2
-0.3
30-39
6,988
57.5
57.1 to 57.9
12,663
58.5
58.2 to 58.8
+1.0
40-49
3,060
56.6
56.0 to 57.2
5,853
58.1
57.7 to 58.6
+1.5
50-59
953
56.0
54.9 to 57.0
2,076
58.4
57.6 to 59.1
+2.4
60-69
223
56.1
53.8 to 58.5
387
59.3
57.5 to 61.1
+3.2
Desire to be different
Age group
Men: n
Men: mean
Men: approx. 95% CI
Women: n
Women: mean
Women: approx. 95% CI
Women minus men
20-29
29,805
56.6
56.4 to 56.8
41,546
56.3
56.1 to 56.5
-0.3
30-39
6,988
52.2
51.8 to 52.7
12,663
51.0
50.7 to 51.4
-1.2
40-49
3,060
51.5
50.8 to 52.2
5,853
49.6
49.2 to 50.1
-1.8
50-59
953
50.4
49.3 to 51.5
2,076
49.1
48.3 to 49.9
-1.3
60-69
223
49.3
46.8 to 51.8
387
46.6
44.8 to 48.5
-2.7
Sexual interest
Age group
Men: n
Men: mean
Men: approx. 95% CI
Women: n
Women: mean
Women: approx. 95% CI
Women minus men
20-29
29,805
60.7
60.5 to 60.9
41,546
57.2
57.1 to 57.4
-3.5
30-39
6,988
65.2
64.8 to 65.6
12,663
59.7
59.3 to 60.0
-5.5
40-49
3,060
65.8
65.1 to 66.5
5,853
57.7
57.2 to 58.2
-8.1
50-59
953
64.0
62.8 to 65.2
2,076
52.7
51.8 to 53.5
-11.3
60-69
223
61.9
59.3 to 64.5
387
49.5
47.5 to 51.5
-12.3
Aversion to adult responsibilities
Age group
Men: n
Men: mean
Men: approx. 95% CI
Women: n
Women: mean
Women: approx. 95% CI
Women minus men
20-29
29,805
45.3
45.1 to 45.5
41,546
45.6
45.5 to 45.8
+0.3
30-39
6,988
44.2
43.8 to 44.7
12,663
40.6
40.3 to 40.9
-3.6
40-49
3,060
43.3
42.7 to 44.0
5,853
39.3
38.8 to 39.8
-4.1
50-59
953
40.8
39.6 to 41.9
2,076
37.0
36.2 to 37.8
-3.8
60-69
223
40.8
38.3 to 43.3
387
36.7
34.9 to 38.4
-4.2
Distress at being ignored
Age group
Men: n
Men: mean
Men: approx. 95% CI
Women: n
Women: mean
Women: approx. 95% CI
Women minus men
20-29
29,805
44.8
44.6 to 45.0
41,546
46.1
45.9 to 46.3
+1.3
30-39
6,988
42.4
41.9 to 42.8
12,663
42.8
42.4 to 43.1
+0.4
40-49
3,060
40.3
39.6 to 41.0
5,853
39.2
38.7 to 39.7
-1.1
50-59
953
37.0
35.8 to 38.2
2,076
34.8
34.1 to 35.6
-2.2
60-69
223
39.0
36.5 to 41.5
387
33.0
31.1 to 34.9
-6.0
Importance of physical beauty
Age group
Men: n
Men: mean
Men: approx. 95% CI
Women: n
Women: mean
Women: approx. 95% CI
Women minus men
20-29
29,805
49.6
49.4 to 49.9
41,546
49.2
49.1 to 49.4
-0.4
30-39
6,988
47.9
47.5 to 48.3
12,663
47.2
46.8 to 47.5
-0.8
40-49
3,060
47.5
46.9 to 48.1
5,853
46.0
45.6 to 46.5
-1.5
50-59
953
46.2
45.1 to 47.4
2,076
44.5
43.7 to 45.3
-1.7
60-69
223
45.6
43.2 to 48.0
387
45.2
43.4 to 47.1
-0.3
Artistic interests / creativity
Age group
Men: n
Men: mean
Men: approx. 95% CI
Women: n
Women: mean
Women: approx. 95% CI
Women minus men
20-29
29,805
55.4
55.1 to 55.7
41,546
58.1
57.9 to 58.4
+2.7
30-39
6,988
53.7
53.2 to 54.3
12,663
52.7
52.3 to 53.1
-1.1
40-49
3,060
53.7
52.9 to 54.5
5,853
52.3
51.7 to 52.9
-1.4
50-59
953
54.8
53.3 to 56.2
2,076
55.6
54.6 to 56.6
+0.8
60-69
223
54.2
51.2 to 57.1
387
53.8
51.5 to 56.1
-0.4
Alcohol / tobacco use and attitudes
Age group
Men: n
Men: mean
Men: approx. 95% CI
Women: n
Women: mean
Women: approx. 95% CI
Women minus men
20-29
29,805
46.5
46.2 to 46.8
41,546
43.0
42.8 to 43.2
-3.5
30-39
6,988
46.0
45.5 to 46.6
12,663
42.2
41.8 to 42.6
-3.8
40-49
3,060
44.3
43.5 to 45.2
5,853
40.7
40.1 to 41.3
-3.6
50-59
953
41.3
39.9 to 42.8
2,076
37.2
36.2 to 38.2
-4.1
60-69
223
38.8
35.8 to 41.9
387
34.4
32.1 to 36.8
-4.4
Exercise
Age group
Men: n
Men: mean
Men: approx. 95% CI
Women: n
Women: mean
Women: approx. 95% CI
Women minus men
20-29
29,805
59.2
58.9 to 59.4
41,546
52.4
52.1 to 52.6
-6.8
30-39
6,988
55.7
55.2 to 56.2
12,663
50.3
49.9 to 50.8
-5.4
40-49
3,060
53.6
52.8 to 54.4
5,853
47.4
46.8 to 48.0
-6.2
50-59
953
50.8
49.3 to 52.3
2,076
45.3
44.3 to 46.4
-5.5
60-69
223
53.0
49.7 to 56.2
387
45.2
42.8 to 47.5
-7.8
Religious faith
Age group
Men: n
Men: mean
Men: approx. 95% CI
Women: n
Women: mean
Women: approx. 95% CI
Women minus men
20-29
29,805
41.9
41.5 to 42.2
41,546
45.2
44.9 to 45.5
+3.3
30-39
6,988
41.7
41.0 to 42.4
12,663
47.3
46.8 to 47.8
+5.6
40-49
3,060
44.8
43.8 to 45.9
5,853
51.5
50.8 to 52.3
+6.7
50-59
953
50.6
48.7 to 52.5
2,076
57.9
56.7 to 59.1
+7.3
60-69
223
49.1
45.2 to 53.1
387
60.1
57.3 to 62.8
+10.9
Humanitarian concern
Age group
Men: n
Men: mean
Men: approx. 95% CI
Women: n
Women: mean
Women: approx. 95% CI
Women minus men
20-29
29,805
57.2
56.9 to 57.4
41,546
60.8
60.6 to 61.0
+3.6
30-39
6,988
57.5
57.1 to 58.0
12,663
60.8
60.5 to 61.1
+3.3
40-49
3,060
58.3
57.7 to 59.0
5,853
60.9
60.5 to 61.3
+2.6
50-59
953
60.6
59.5 to 61.8
2,076
62.5
61.7 to 63.2
+1.9
60-69
223
61.2
58.8 to 63.7
387
62.2
60.6 to 63.9
+1.0
Saving / spending control
Age group
Men: n
Men: mean
Men: approx. 95% CI
Women: n
Women: mean
Women: approx. 95% CI
Women minus men
20-29
29,805
53.4
53.2 to 53.7
41,546
53.2
52.9 to 53.4
-0.3
30-39
6,988
49.9
49.3 to 50.4
12,663
49.9
49.5 to 50.3
+0.0
40-49
3,060
50.2
49.5 to 51.0
5,853
50.3
49.8 to 50.9
+0.1
50-59
953
51.1
49.8 to 52.4
2,076
52.8
51.9 to 53.8
+1.7
60-69
223
53.9
51.2 to 56.6
387
54.6
52.5 to 56.7
+0.7
Self-rated attractiveness
Age group
Men: n
Men: mean
Men: approx. 95% CI
Women: n
Women: mean
Women: approx. 95% CI
Women minus men
20-29
29,805
57.7
57.5 to 57.9
41,546
63.1
62.9 to 63.3
+5.4
30-39
6,988
57.0
56.6 to 57.5
12,663
61.9
61.5 to 62.2
+4.9
40-49
3,060
54.4
53.8 to 55.1
5,853
59.3
58.8 to 59.8
+4.9
50-59
953
52.2
51.0 to 53.4
2,076
55.9
55.1 to 56.7
+3.7
60-69
223
52.0
49.5 to 54.6
387
54.2
52.3 to 56.1
+2.1
Keeping promises
Age group
Men: n
Men: mean
Men: approx. 95% CI
Women: n
Women: mean
Women: approx. 95% CI
Women minus men
20-29
29,805
59.6
59.4 to 59.8
41,546
59.1
59.0 to 59.3
-0.5
30-39
6,988
61.5
61.1 to 61.9
12,663
62.8
62.5 to 63.1
+1.3
40-49
3,060
62.3
61.7 to 62.9
5,853
63.9
63.4 to 64.3
+1.5
50-59
953
63.0
61.9 to 64.1
2,076
65.1
64.4 to 65.8
+2.0
60-69
223
63.1
60.8 to 65.4
387
65.7
64.1 to 67.2
+2.6
Admitting mistakes
Age group
Men: n
Men: mean
Men: approx. 95% CI
Women: n
Women: mean
Women: approx. 95% CI
Women minus men
20-29
29,805
58.3
58.1 to 58.5
41,546
55.4
55.2 to 55.6
-3.0
30-39
6,988
62.3
61.9 to 62.7
12,663
60.5
60.2 to 60.8
-1.8
40-49
3,060
63.4
62.8 to 64.0
5,853
63.8
63.3 to 64.2
+0.3
50-59
953
65.3
64.3 to 66.4
2,076
65.0
64.3 to 65.7
-0.3
60-69
223
62.4
60.0 to 64.8
387
63.6
62.0 to 65.2
+1.2
Suspicion of others
Age group
Men: n
Men: mean
Men: approx. 95% CI
Women: n
Women: mean
Women: approx. 95% CI
Women minus men
20-29
29,805
51.7
51.5 to 51.9
41,546
50.7
50.6 to 50.9
-1.0
30-39
6,988
50.2
49.8 to 50.6
12,663
48.8
48.5 to 49.1
-1.4
40-49
3,060
49.1
48.4 to 49.7
5,853
47.3
46.9 to 47.8
-1.8
50-59
953
46.8
45.7 to 47.9
2,076
43.3
42.6 to 44.0
-3.5
60-69
223
47.4
45.3 to 49.6
387
43.3
41.6 to 44.9
-4.2
Expensive consumption
Age group
Men: n
Men: mean
Men: approx. 95% CI
Women: n
Women: mean
Women: approx. 95% CI
Women minus men
20-29
29,805
38.8
38.6 to 39.0
41,546
33.2
33.0 to 33.4
-5.6
30-39
6,988
38.5
38.0 to 38.9
12,663
33.3
33.0 to 33.6
-5.2
40-49
3,060
36.5
35.9 to 37.2
5,853
31.8
31.3 to 32.3
-4.7
50-59
953
34.8
33.5 to 36.0
2,076
31.3
30.5 to 32.1
-3.5
60-69
223
34.4
31.7 to 37.1
387
34.5
32.5 to 36.4
+0.1
Desire for children / family
Age group
Men: n
Men: mean
Men: approx. 95% CI
Women: n
Women: mean
Women: approx. 95% CI
Women minus men
20-29
29,805
55.0
54.8 to 55.3
41,546
59.6
59.4 to 59.8
+4.6
30-39
6,988
57.6
57.1 to 58.1
12,663
65.8
65.5 to 66.2
+8.2
40-49
3,060
58.0
57.2 to 58.8
5,853
67.8
67.2 to 68.3
+9.7
50-59
953
59.4
58.0 to 60.8
2,076
68.5
67.6 to 69.3
+9.1
60-69
223
59.0
56.1 to 61.8
387
70.0
68.1 to 71.9
+11.1
Self-rated excess weight
Age group
Men: n
Men: mean
Men: approx. 95% CI
Women: n
Women: mean
Women: approx. 95% CI
Women minus men
20-29
29,805
39.1
38.8 to 39.4
41,546
45.0
44.7 to 45.2
+5.8
30-39
6,988
48.0
47.4 to 48.6
12,663
54.4
53.9 to 54.9
+6.5
40-49
3,060
53.4
52.5 to 54.3
5,853
59.1
58.4 to 59.8
+5.7
50-59
953
57.2
55.7 to 58.8
2,076
63.4
62.3 to 64.5
+6.2
60-69
223
55.2
51.8 to 58.7
387
63.3
60.8 to 65.7
+8.0
Sample Sizes, Methods and Limits
Approximate age
Men
Women
Total
20-29
29,805
41,546
71,351
30-39
6,988
12,663
19,651
40-49
3,060
5,853
8,913
50-59
953
2,076
3,029
60-69
223
387
610
Coverage. This uses all retained profiles in the age range, not the balanced 30,000-men/30,000-women export. Each decade has at least 200 people in each gender, with at least 80 in each split half. The sixties group has only 223 men and 387 women, so it should be read more cautiously than the much larger twenties group. Ages 18-19 and 70-80 are outside the requested decade charts; the latter also has insufficient male coverage.
Approximate age. Age is the calendar year of the stored test date minus recorded birth year. It can be about a year different from exact age. Some birth years may have been inferred from graduation information; the data do not identify which. The stored test date can represent a retake, while profile metadata may have been collected or updated at a different time.
Measures. The database stores calculated trait scores, not completed item answers. These 38 dimensions mix personality preferences with self-ratings such as wealth, attractiveness and excess weight. They are not objective income, attractiveness or body-mass measurements. Intellectual interests is not an IQ test; competence/superiority is not a diagnosis. The original attractiveness content partly refers to opposite-sex attention. The separate height, same-gender-attraction and music items are outside these 38 dimensions.
Filtering and denominators. Retained profiles have a test date on or after April 26, 2008, all 41 stored scores in 0-100, at least one score different from the all-50 default, recorded male/female metadata, and approximate age 20-69. Male/female are the only recorded gender categories available here. A stored profile, rather than a test attempt, is the unit of analysis; retake history is not available in this extract.
Estimation. Means, sample standard deviations and mean intervals come directly from aggregate counts, score sums and squared-score sums. Approximate 95% mean intervals are mean +/- 1.96 times SD divided by the square root of the group count. SD contrasts divide the older-minus-younger mean difference by the trait SD among all retained 20-69-year-olds of that gender, not the SD of just the two compared groups. This is not conventional pooled-group Cohen's d. The data are split reproducibly by profile identity; the discovery half fixes rankings and the holdout half checks consistency.
Interpretation. These are descriptive, unadjusted age-group means within recorded gender. Education, country, relationship status, test-taking selection and generational background are not controlled. No result establishes a causal effect of age or gender. Shared social networks and response tendencies can violate independence and make nominal intervals too narrow. Exploring many traits can also inflate standout differences; split-half checks reduce but do not remove that risk.
Bottom line: the charts describe how this historical sample differs across age groups. They do not show a universal life trajectory, predict an individual's future personality, or establish that one age or gender is better than another.
 similarminds.com